Utilizing tmux to Create a Server Monitoring Dashboard
One of The Nebula Centre Project's primary goals is to provide a platform for members to share their ideas and creations. In this article, the lead technical director of The Nebula Centre Project, EM Martin, shares a creation they developed during their time directing the technical operations of The Nebula Centre Project.Author: EM Martin
Date Published: 02 August 2020
One of the most time consuming, yet critical, parts of my position at The Nebula Centre Project is monitoring the servers providing the services of The Nebula Centre Project. Aside from logging and general alerts for potential issues, I like to know in a few seconds the status of the machines providing our services. There are many applications for providing individual statistics for a certain aspect of the machine (such as CPU temperature, memory usage, network activity, etc) including:
- htop
- lm_sensors
- nethogs
- iotop
- df
Glances
A great example of such is Glances (shown below).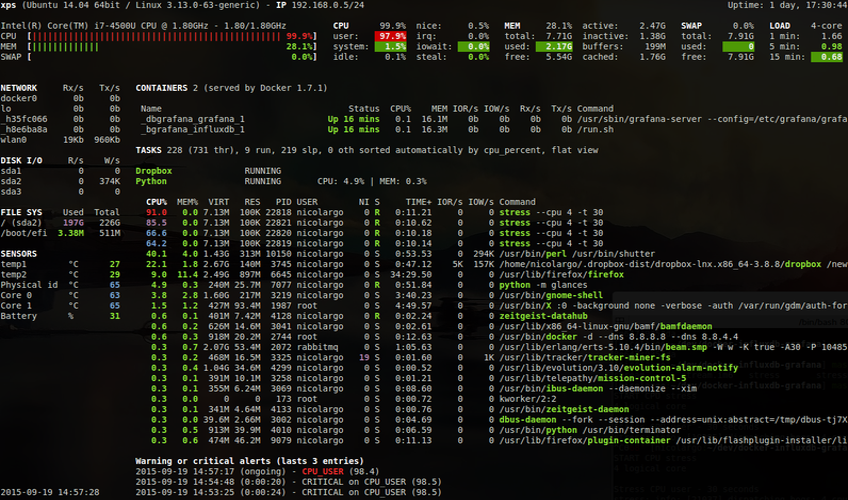
Image source: Glances Github page (https://nicolargo.github.io/glances/)
As you can see, Glances provides a lot of information in one view, however some of that information is not very detailed. Specifically:
- Network details only go as specific to the interface. Network use per application is not available.
- Likewise, disk use is only shown per mounted drive. Disk use per application is not available.
- Status of services is not shown, one must hope their respective applications appear in the process table.
- CPU load information is split into seven different numbers. This could be summarized in one number.
- Memory usage is also split in a similar manner. This data could be determined as not very important.
- Alerts are displayed. I prefer to receive alerts via email, as I can be notified immediately when there is a potential issue. Displaying them in such an interface is rather redundant.
Netdata
Another potential solution I looked at is Netdata (shown below).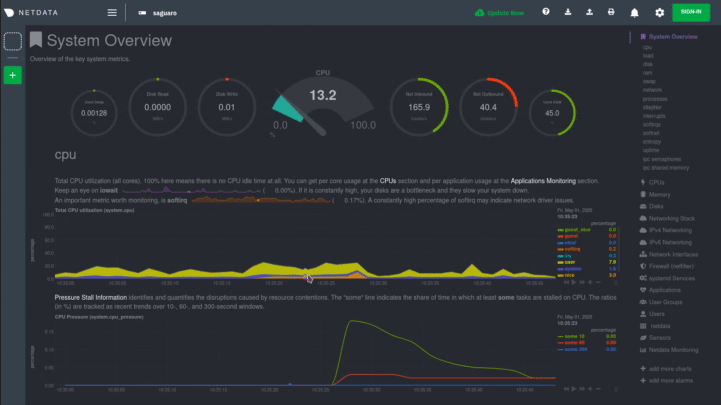
Image source: Netdata git repository (https://github.com/netdata/netdata/)
Netdata is the complete inverse of Glances. Glances attempts to provide a quick way to see the general status of a system. Netdata, on the other hand, attempts to provide as much detail as possible. In my experience, it is nearly impossible to find a part of a server you can't monitor with Netdata. I highly suggest you read the README on Netdata's git repository, as it is amazing how vast the project is and how detailed one can configure it. However, as much as I love detailed information and statistics, there is such a thing as information overload, and Netdata is a clear example of it. This is also coupled with Netdata's frontend being through the web. I would much prefer something lighter on resources as well as an interface I could access in an ssh or mosh session.
tmux
I then thought of using tmux (shown below). Tmux is what is known as a "terminal multiplexer", or an application to show multiple terminal sessions in one view.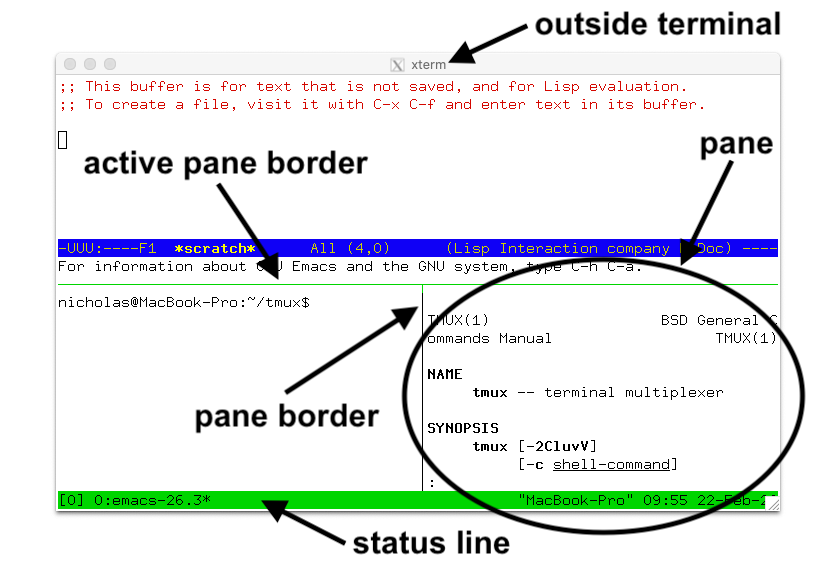
Image source: tmux wiki (https://raw.githubusercontent.com/wiki/tmux/tmux/images/tmux_pane_diagram.png)
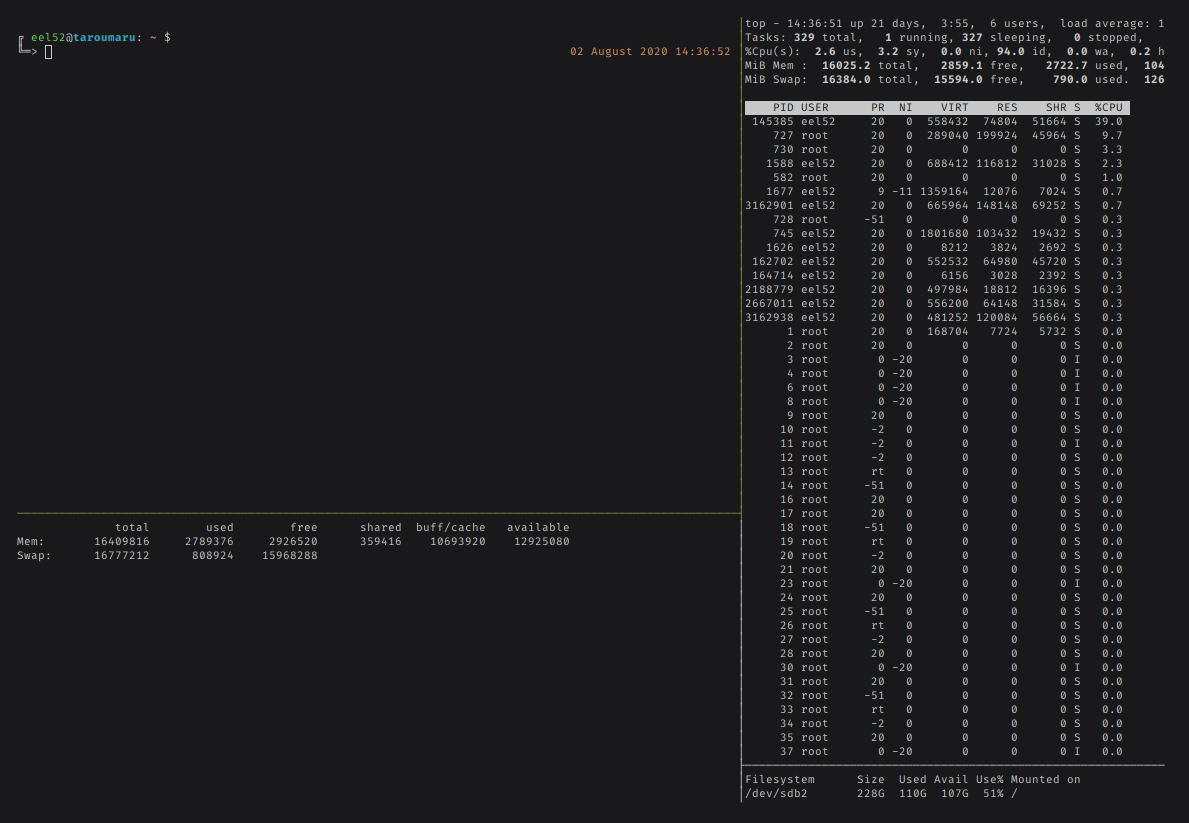
Tmux is unique compared to Glances and Netdata, in that it is not strictly a monitoring utility. This makes it rather versatile. Using the TUI applications I mentioned in the beginning of the article, I created the interface shown below.
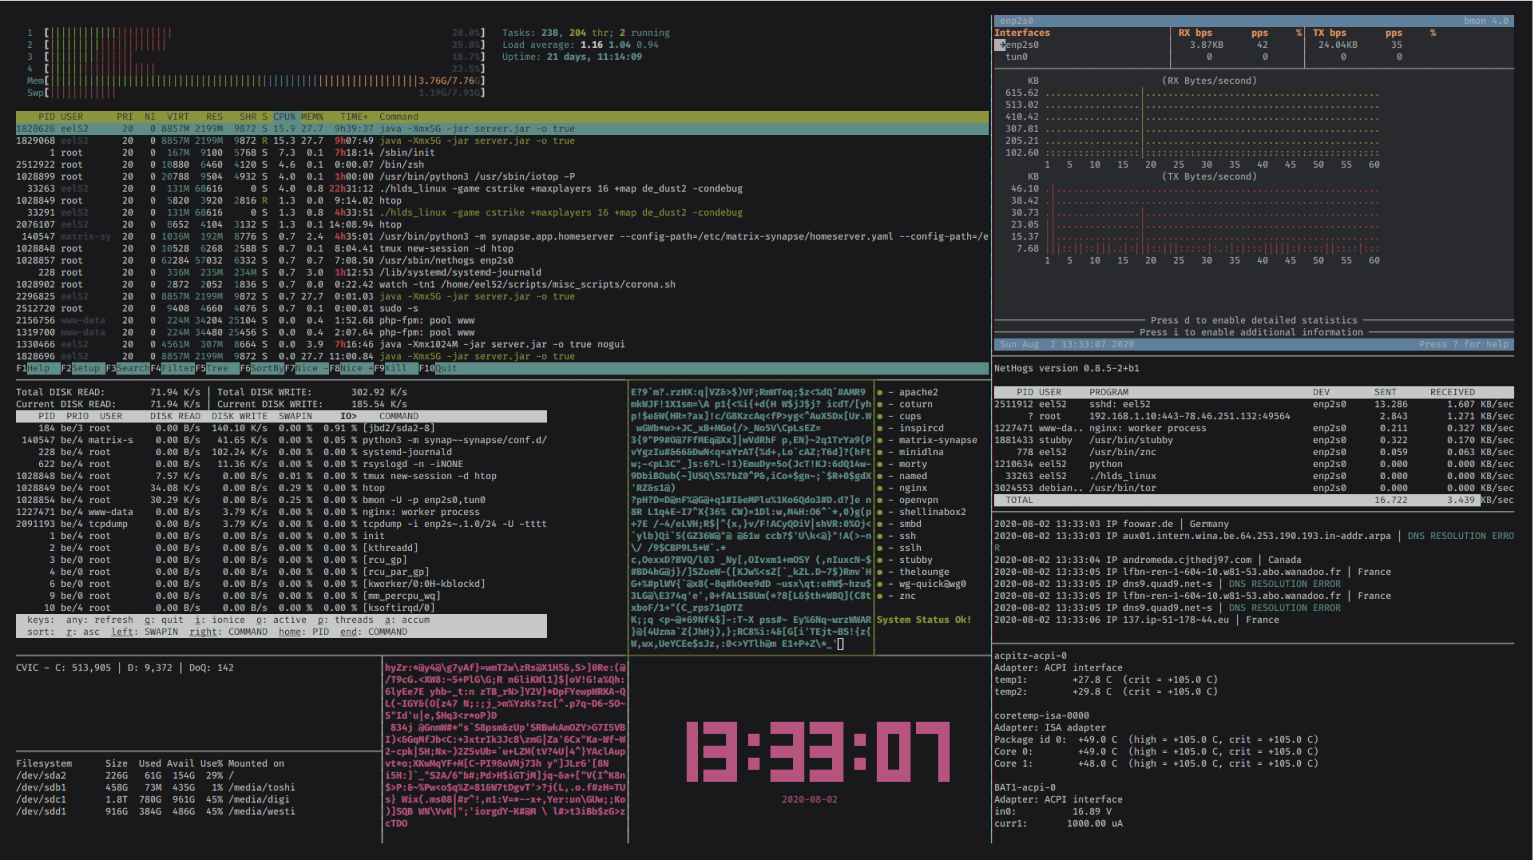
This allows me to see all the information I need in one place, including (clockwise):
- CPU, Memory and Swap information from htop
- Network statistics per interface with bmon
- Network statistics per application with nethogs
- Inbound packets with my own script
- CPU temperature with lm_sensors
- Used and free space per mounted drive with df
- Disk utilization with iotop
- System services with my own script
Creating the Dashboard
Now how to create such an interface? It is rather simple to do so, and only requires some basic knowledge of tmux, shell scripting and a bit of patience.Let's create the initialization file for our monitoring interface:
tmux-init.sh
#######################
#!/bin/sh
tmux new-session 'htop'
tmux-dash.sh
Now, execute chmod +x tmux-init.sh to make the script executable.
Tmux has a rich set of commands that allow a user to do almost anything they can typically do while attached to the session, through a shell session. Assuming you have a tmux session running, run the following commands in a separate terminal:
tmux split-window -h 'top'
tmux split-window -v 'watch -tn1 df -h /'
tmux select-pane -L
tmux split-window -v 'watch -tn1 free'
tmux select-pane -R
tmux resize-pane -D 20
This demonstrates the basic principles behind creating a dashboard in tmux. Specifically, splitting panes, resizing them and navigating among them. Taking a look at the first twelve lines of tmux-dash.sh (shown below), one can see how the different commands start to come together.
tmux split-window -h '/usr/bin/bmon -U -p enp2s0,tun0'
tmux split-window -v '/usr/sbin/nethogs enp2s0'
tmux split-window -v '/home/eel52/scripts/misc_scripts/tcpdumphuman.sh'
tmux select-pane -U
tmux select-pane -U
tmux resize-pane -U 7
tmux resize-pane -R 40
tmux select-pane -D
tmux resize-pane -U 12
tmux select-pane -D
- Executing tmux new-session 'htop'
- Using a variety of '^b + %' and '^b + "', depending if I needed a vertical split or a horizontal split, respectively
- Using resize-pane -UDLR xx to resize each pane to my liking
- Translating the action into the corresponding tmux command and adding it to tmux-dash.sh
After repeating the last three aforementioned steps and some minor adjustments, I was yielded tmux-dash.sh. If you intend on using this script, make sure to substitute other applications or your own scripts for splits that require my own monitoring scripts.
Conclusion
There are many options out there for server monitoring, I am sure I have missed many other great options. However, using tmux allows for anyone to build their own monitoring interface from the ground up, resulting in an extremely customizable experience that is light on resources, looks great and functions excellently.Thank you for reading, if you have any inquiries or comments on this article, I can be reached via email at emartin@nebulacentre.net.